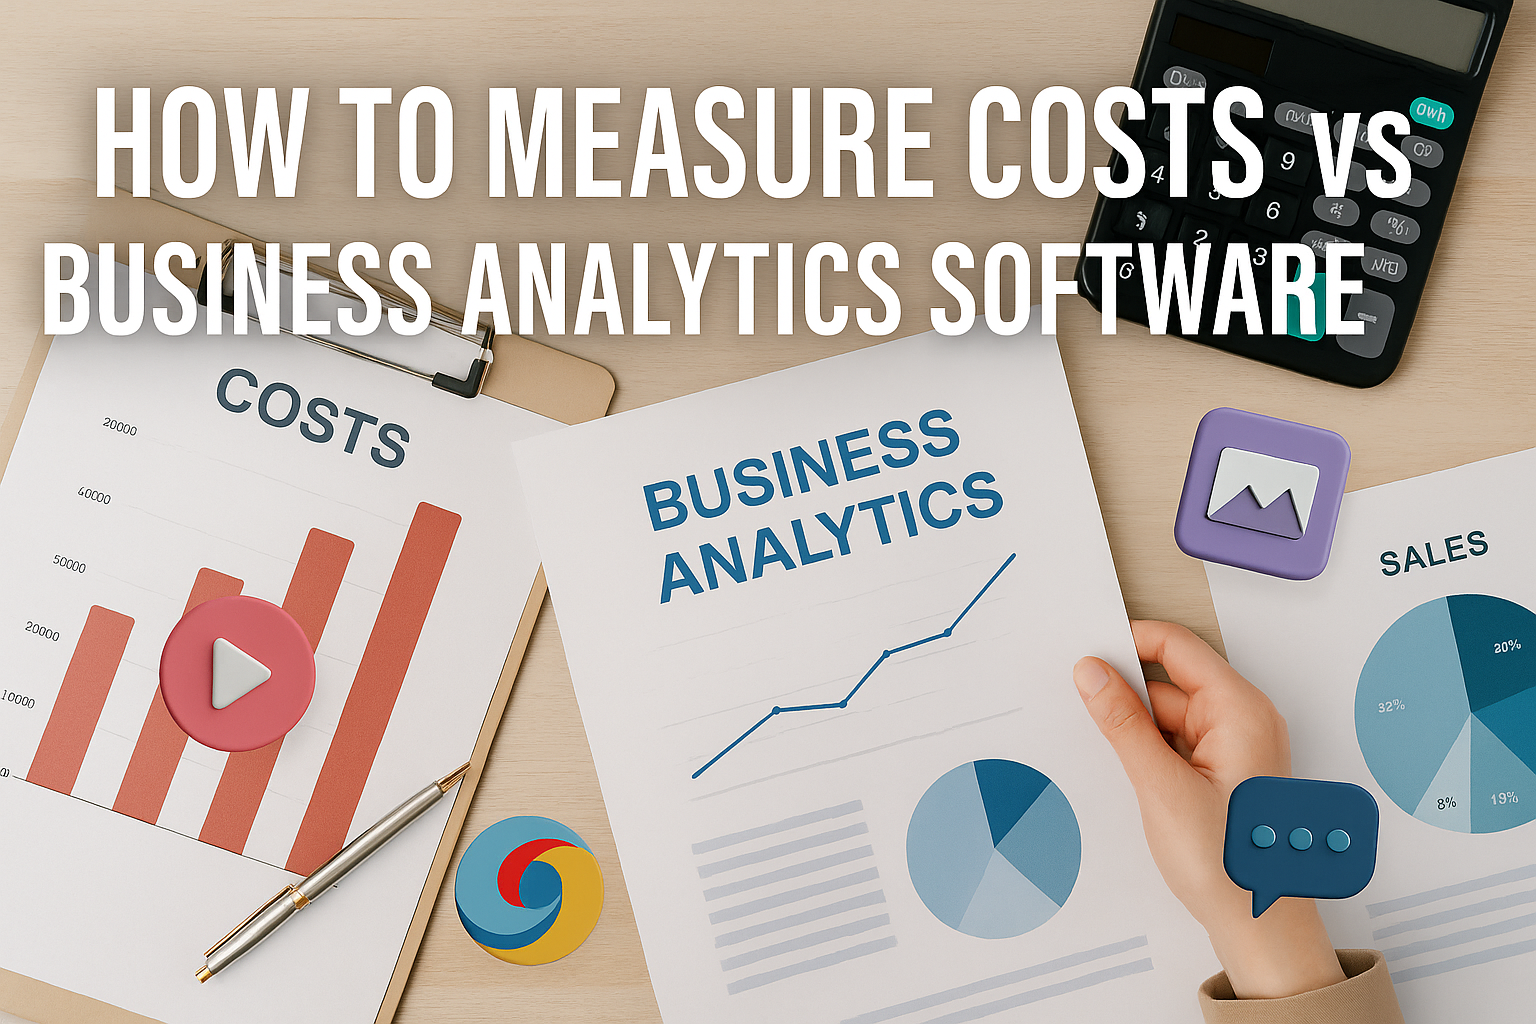
How to Measure Costs vs Business Analytics Software
Business analytics software promises to turn data into insight — but how do you know if it’s actually worth the cost? In an era where every software platform claims to deliver value, understanding how to measure costs versus benefits has become essential. The right analytics tool can transform your decision-making, but the wrong one can quietly drain your budget.
Let’s explore how to assess the financial impact of your analytics investment — and what metrics truly matter when evaluating cost versus return.
Understanding the True Cost of Business Analytics Software
When choosing a business analytics platform, the subscription price is only the starting point. Real cost involves the full ecosystem around the software — including setup, training, and integration.
Here’s what to consider:
1. Licensing and Subscription Fees
Most analytics tools — such as Power BI, Tableau, or Zoho Analytics — offer tiered pricing models. Entry-level plans may seem affordable, but enterprise-level functionality often comes at a premium. Compare pricing per user, per data source, and per feature to understand the real financial commitment.
2. Implementation and Integration Costs
Connecting your analytics tool to CRMs, accounting systems, or eCommerce platforms can take time and expertise. Even if integrations are “built-in,” configuring data pipelines often requires IT support or third-party consultants. These hidden setup costs can exceed the subscription fee in the first year.
3. Training and User Adoption
The best analytics software is only useful if people actually know how to use it. Consider training time and costs — both initial and ongoing. Many companies underestimate the learning curve, especially for tools like Tableau or Qlik Sense, which require data literacy to maximize value.
4. Maintenance and Data Management
Data needs constant updating. Whether it’s maintaining database connections or cleaning and validating information, someone has to ensure your analytics remain accurate. Maintenance may not have a visible price tag, but it carries a resource cost — typically in IT or analyst time.
Calculating Return on Investment (ROI)
Once you’ve mapped out the full cost, it’s time to measure what you get back. The ROI of business analytics tools is found in efficiency, accuracy, and decision quality — not just raw revenue.
Here’s how to evaluate it:
1. Time Saved on Reporting
Automated dashboards reduce manual reporting hours. If your analysts spend 20 hours a week compiling reports, and automation cuts that by 75%, calculate the labor cost saved. Multiply it by your team’s hourly rate, and you’ll see immediate ROI.
2. Faster Decision-Making
Access to real-time data shortens reaction time. Businesses that can adjust campaigns, pricing, or supply chains based on live insights typically see improved performance. Time-to-decision is a measurable ROI metric, even if it doesn’t directly appear on your balance sheet.
3. Reduction in Errors
Manual reporting often leads to data inaccuracies, which can cost thousands in poor decisions. Automation and validation features in analytics tools minimize these errors — creating both cost savings and risk reduction value.
4. Improved Resource Allocation
Data clarity allows smarter spending. Whether it’s reallocating ad budgets or adjusting inventory based on trends, analytics prevents waste. Calculate ROI by tracking how these adjustments directly influence profitability.
5. Competitive Advantage
Analytics isn’t just about cutting costs — it’s about gaining insights faster than your competitors. While harder to quantify, the strategic value of being data-driven is one of the strongest long-term returns on investment.
Using Key Metrics to Compare Tools
When evaluating analytics platforms, consider measurable metrics that reflect cost and performance. Here’s a practical framework to compare options:
✔ Cost per active user (monthly or annual).
✔ Implementation time to first insight.
✔ Report automation percentage.
✔ Data source compatibility (how many integrations supported).
✔ Learning curve and average training time.
✔ Scalability and upgrade flexibility.
These metrics give you a balanced view of both financial and functional value — helping you see beyond the subscription fee.
When Cheaper Isn’t Better
It’s tempting to choose low-cost analytics software, but cheaper isn’t always smarter. Free or entry-level tools often lack advanced visualization, predictive features, or secure data handling. Over time, these limitations can stall your growth and cost more in inefficiencies.
Instead of focusing on price, evaluate tools based on cost-to-value ratio — how much actionable insight you gain per dollar spent.
How to Present the Business Case for Analytics Investment
If you’re pitching analytics software to leadership, build your business case around ROI rather than just cost. Combine data-driven projections with qualitative value — like better decision speed, risk reduction, and strategic agility.
A simple ROI equation can help: ROI (%) = (Net Benefits ÷ Total Costs) × 100
For instance, if analytics saves your business $50,000 annually and costs $15,000 to operate, your ROI is roughly 233% — an impressive number for decision-makers.
Final Thoughts: Measure Value, Not Just Expense
Business analytics software shouldn’t be viewed as an expense — it’s an investment in smarter, faster decision-making. The goal isn’t just to minimize cost, but to maximize impact.
When used effectively, analytics tools create a feedback loop of insight and efficiency — paying for themselves many times over. By measuring both direct and indirect returns, you’ll not only justify the spend but also prove that data truly drives growth.
Don’t ask, “How much does it cost?” Ask, “How much does it return?”
| Tool | Typical Annual Cost* | Implementation (One-time) | Training (per user) | Time to First Insight | Automation Potential | Sample ROI (1-Year) | Best For |
|---|---|---|---|---|---|---|---|
| Microsoft Power BI | $2,400–$9,600 (10–40 Pro users) + optional Premium | $3,000–$12,000 (connectors, data model) | 6–12 hours | 2–4 weeks | High (scheduled refresh, Power Automate) | ~215% (see assumptions) | Microsoft-centric teams, finance, ops |
| Tableau | $6,000–$24,000 (10–40 Creator/Explorer mix) | $6,000–$20,000 (server/cloud setup, governance) | 10–20 hours | 3–6 weeks | High (prep flows, subscriptions) | ~180% (see assumptions) | Data-rich teams needing premium viz |
| Google Looker Studio | $0 (core) + $1,200–$6,000 (paid connectors) | $1,500–$6,000 (connectors, data blending) | 3–6 hours | Days–2 weeks | Medium (scheduling via BigQuery/Sheets) | ~260% (see assumptions) | Marketing, SMBs, Google stack users |
| Zoho Analytics | $1,200–$6,000 (plan & users) | $2,000–$8,000 (integrations, data prep) | 4–8 hours | 2–4 weeks | Medium–High (Zia AI, sched. imports) | ~230% (see assumptions) | SMBs, cross-department dashboards |
ROI Assumptions (example mid-size team)
- Team: 1 analyst + 8 business users; blended labor cost $60/hour.
- Pre-analytics manual reporting: 15 hrs/week → automated to 4 hrs/week (save 11 hrs/week ≈ 572 hrs/year ≈ $34,320).
- Faster decisions: conservatively +$20,000/year uplift (pricing, campaigns, inventory).
- Error reduction: avoid $8,000/year in rework/incorrect decisions.
Estimated Annual Benefits ≈ $34,320 + $20,000 + $8,000 = $62,320
Estimated Annual Costs = License + Connectors + (Annualized portion of setup & training)
ROI (%) = [(Benefits − Costs) ÷ Costs] × 100 — adjust benefits/costs per your environment.